Average Percent Correct

The most effective indicator of quality of implementation and indeed of quality of reading comprehension is Average Percent Correct (APC)—the extent to which pupils score highly on book quizzes. Renaissance recommends that pupils score 85% or higher if they are to really benefit from the programme.

Star Reading generates individual outcome scores: The Scaled Score (from 1 to 1400) and the Percentile Rank (the percentage of scores that fall at or below a certain observation). Table 3 gives the average on these measures for all students who had both a Star Reading score and AR data.

Of 1,097,410 pupils with Star scores, Years 11 through 13 show very small numbers using AR, and there are low scores on all three measures, suggesting these do not fit the pattern and are anomalous. Years 1-10 do, however, show a very clear pattern on all measures, and all show Star scores above average, i.e., above the 50th percentile (Table 3).

For the remainder of this section of the analysis, students’ Star reading scores are divided into quartiles: Percentile 1-24, Percentile 25-49, Percentile 50-74, and Percentile 75 to 100 (percentiles are a score at or below which a given percentage of the distribution falls). The four groups are used to give an indication of the relationship of other factors to the reading performance of the students. Figure 1 shows the relationship for each year between the quartiles of students in relation to their Star reading scores and their APC on quizzes (Table 4).

In all years, there is a consistent pattern whereby the lowest APC scores are associated with the lowest reading scores, the highest with the highest reading scores, and the middle APC scores are associated with the middle reading scores. Obviously, implementation quality makes a big difference!

Engaged Reading Time

Another indication of implementation quality is given by Engaged Reading Time (ERT). ERT is derived from Accelerated Reader points. For each Reading Practice Quiz taken by a student, Accelerated Reader points are calculated based on the length and difficulty of the book and the student’s performance (i.e., number of items correct) on the quiz. These points are then used to calculate an estimate of ERT, thus:

AR points earned = 10 + ATOS Book level X words in book
10
Then, ERT = (AR points earned) x (minutes per point value)
10


If ERT is low, we might expect less growth in attainment; if it is high, we would expect more. Investigating quartiles of student reading scores and relating them to ERT we find that ERT is in every year highly related to reading performance (see Figure 2).

A pattern emerges that is very similar to that for APCs (Table 5 provides more detail), but Engaged Reading Time seems to be an even more powerful predictor of Star Reading Scores. The lowest ERT scores are associated with the lowest reading scores, the highest with the highest reading scores, and the middle ERT scores are associated with the middle reading scores. More reading time in school leads to higher reading attainment. Implementation quality does indeed make a big difference!

Engaged Reading Time and Cumulative Words Read

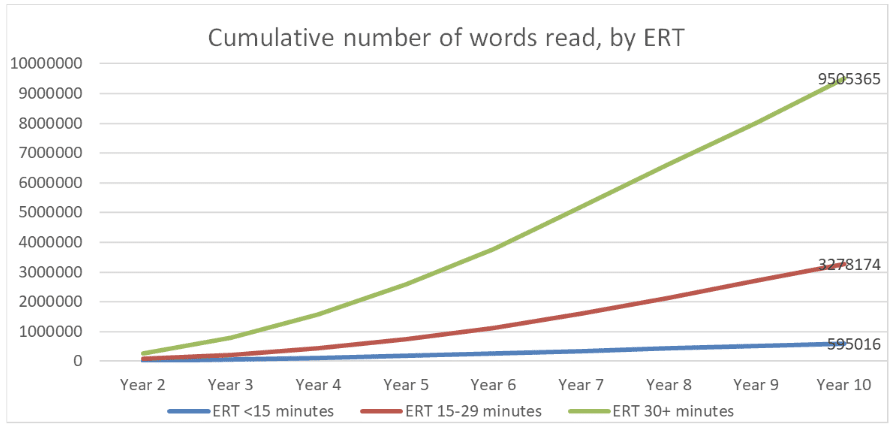
If we graph the cumulative number of words read by ERT, we see further evidence of the impact of time spent reading – the more time is allocated to reading, the greater is the number of words read.

Figure 3 shows the difference between 15 minutes of ERT, 15-29 minutes of ERT and ERT of 30+ minutes (Table 5 in the Appendix gives more detail, including showing that especially in the upper grades there was generally little time given to reading).

Figure 3: Cumulative Number of Words Read, By ERT 


However, in Years 2-6, the number of students in the low Engaged Reading Time sector (less than 15 minutes per day) was considerably higher than in the previous year (although this was not the case for higher Years). The number of students in the high Engaged Reading Time sector (30 minutes or greater per day) was considerably lower than for the previous year, not only for primary but also for the secondary sector. This suggests that the amount of time allocated to reading in school had fallen significantly from the previous year, especially in primary.

Zone of Proximal Development

Turning now to the Zone of Proximal Development (ZPD), this is the difficulty level of a text which has just enough challenge to promote reading growth in pupils. If reading is done at a level below the ZPD, little or no growth in attainment is likely to occur, although the pupil is likely to score highly on the quiz. Similarly, if reading is done at a level above the ZPD, in theory, the text will be too hard, and no growth in achievement will occur. The range of numerical values for each pupil in each year is derived from the Star norm-referenced reading test. Given the ZPD for each child, we can establish how many books were read that were below the ZPD and how many were above it (and, of course, how many were within it). Figure 4 shows the pattern.

It is evident from Figure 4 that there is an increasing tendency to read books which are below ZPD as pupils progress into and through secondary school, coupled with a decline in the tendency to read books above the ZPD. Paradoxically, secondary pupils read more books within their ZPD, but this is because they do not read so many above their ZPD.

Considering the Average Percent Correct of books read below, at or above the ZPD, we find as follows (Figure 5): Books read below ZPD were read more accurately, while books read within ZPD were read less accurately but still generally within the recommended rate of 85%. Even books above ZPD were generally read at the 85% rate, especially in the younger Years.

Summary

Overall, then, the pattern is very clear. For all readers, high levels of implementation in terms of APC and ERT are associated with high levels of reading achievement throughout the year, while low levels of implementation are associated with low levels of achievement. ERT, in terms of minutes allocated to reading, showed a very strong relationship with the number of words read. However, the amount of time allocated to reading in school had fallen significantly from the previous year, especially in primary. Books read tended to be read with accuracy if below ZPD, with less accuracy if within ZPD, and with even less accuracy if above ZPD. However, much of the reading below or at ZPD was still beyond the 85% rate, much as last year. The notion of ZPD is useful in investigating implementation quality.